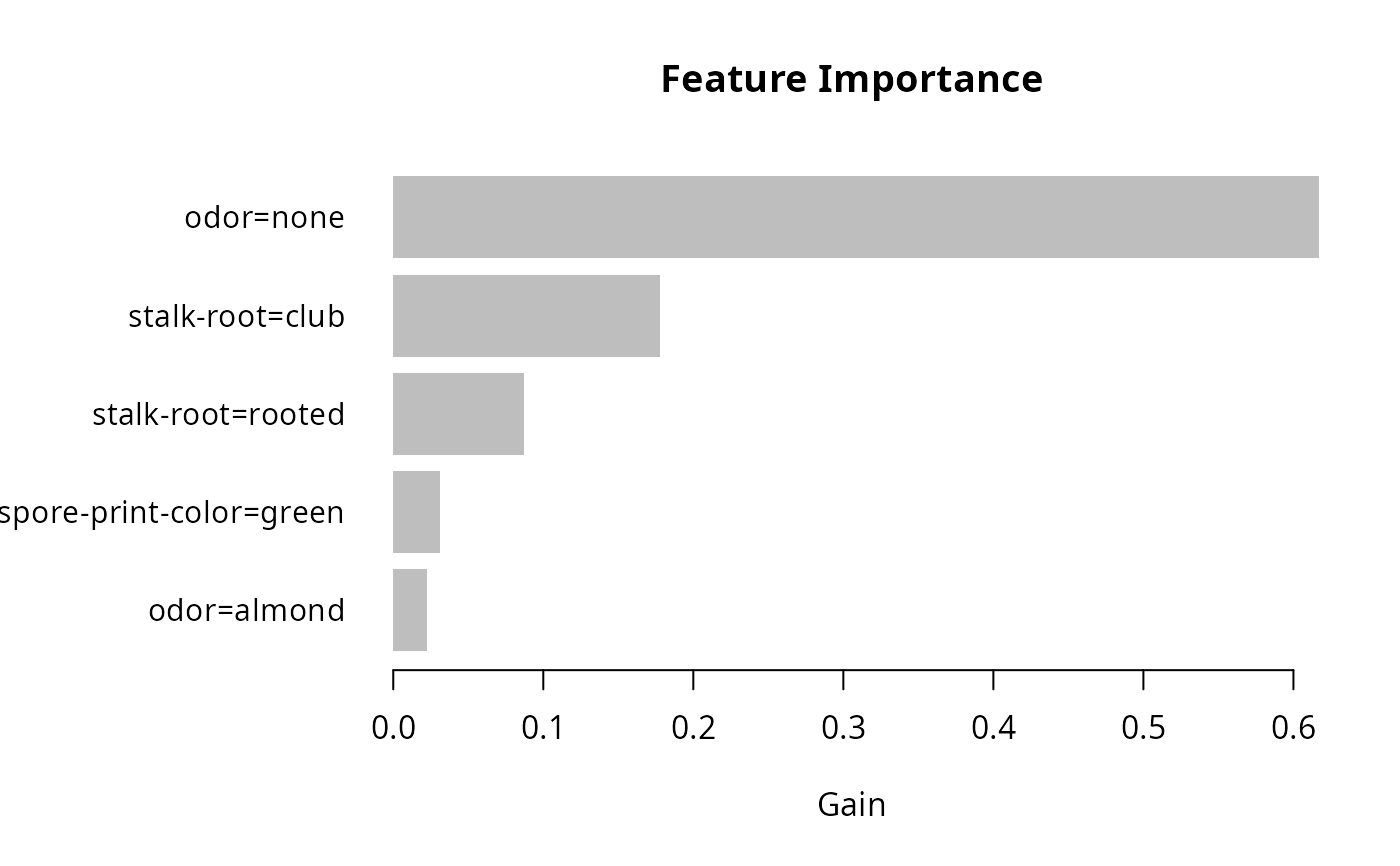
Plot previously calculated feature importance: Gain, Cover and Frequency, as a bar graph.
Arguments
- tree_imp
a
data.tablereturned bylgb.importance.- top_n
maximal number of top features to include into the plot.
- measure
the name of importance measure to plot, can be "Gain", "Cover" or "Frequency".
- left_margin
(base R barplot) allows to adjust the left margin size to fit feature names.
- cex
(base R barplot) passed as
cex.namesparameter tobarplot. Set a number smaller than 1.0 to make the bar labels smaller than R's default and values greater than 1.0 to make them larger.
Value
The lgb.plot.importance function creates a barplot
and silently returns a processed data.table with top_n features sorted by defined importance.
Details
The graph represents each feature as a horizontal bar of length proportional to the defined importance of a feature. Features are shown ranked in a decreasing importance order.
Examples
# \donttest{
data(agaricus.train, package = "lightgbm")
train <- agaricus.train
dtrain <- lgb.Dataset(train$data, label = train$label)

params <- list(
    objective = "binary"
    , learning_rate = 0.1
    , min_data_in_leaf = 1L
    , min_sum_hessian_in_leaf = 1.0
    , num_threads = 2L
)

model <- lgb.train(
    params = params
    , data = dtrain
    , nrounds = 5L
)
#> [LightGBM] [Info] Number of positive: 3140, number of negative: 3373
#> [LightGBM] [Info] Auto-choosing row-wise multi-threading, the overhead of testing was 0.000436 seconds.
#> You can set `force_row_wise=true` to remove the overhead.
#> And if memory is not enough, you can set `force_col_wise=true`.
#> [LightGBM] [Info] Total Bins 232
#> [LightGBM] [Info] Number of data points in the train set: 6513, number of used features: 116
#> [LightGBM] [Info] [binary:BoostFromScore]: pavg=0.482113 -> initscore=-0.071580
#> [LightGBM] [Info] Start training from score -0.071580
#> [LightGBM] [Warning] No further splits with positive gain, best gain: -inf
#> [LightGBM] [Warning] No further splits with positive gain, best gain: -inf
#> [LightGBM] [Warning] No further splits with positive gain, best gain: -inf
#> [LightGBM] [Warning] No further splits with positive gain, best gain: -inf
#> [LightGBM] [Warning] No further splits with positive gain, best gain: -inf

tree_imp <- lgb.importance(model, percentage = TRUE)
lgb.plot.importance(tree_imp, top_n = 5L, measure = "Gain")

# }
# }